From Conversations to Conversions
Measuring User Intent & Engagement in AI Agents
When you use traditional analytics tool in web or mobile apps - where the UX flow is predefined, its easy to measure and baseline how users interact with your app.
But user interactions within a conversational interface is not predefined, hence traditional analytics cannot help measure engagement and conversion within human-AI interactions.
This is where AI-native analytics — and Mindlytics — come in.
In this post, we’ll walk through:
- A concrete AI agent use case
- Decoding the user intents that actually matter
- The KPIs product managers should track
- How Mindlytics’ visualization portal turns raw conversations into actionable insight
The Use Case: An Airline “Smart Concierge” AI Agent
Imagine you’re a product manager responsible for an Airline Concierge AI Agent used across web, mobile, and messaging channels.
The agent handles:
- Flight booking & modifications
- Seat upgrades
- Baggage questions
- Delays, cancellations, and rebooking
- Loyalty program inquiries
- Reduce call center volume
- Increase self-service completion
- Improve customer satisfaction
- Drive ancillary revenue (upgrades, add-ons)
- Loyalty program inquiries
To answer that, you need to understand and track intent while users interact with the agent.
Thinking in Intents (Not Events)
In conversational products, intent replaces the idea of “page views” or “button clicks" of traditional apps.
For our airline agent, some key intents might be:
Check flight statusChange flightUpgrade seatAdd baggageTalk to an agent
- A single intent
- Multiple intents
- A failed or abandoned intent
- An intent that changes mid-conversation
Core KPIs Every AI Agent PM Should Track
Immediately after mindlytics SDK is instrumented in your agent or AI app, mindlytics begins to decode user intent within conversations and tracks relevent conversational analytics events to compute a comprehensive set of, ready to use intent-centric KPIs.
These default KPIs, also referred as foundational KPIs are immediately accessible from the Mindlytics visualization portal.
In addition to the foundational KPIs, you could create various analysis charts to track metrics specific to your app and business.
1. Foundational KPIs
The foundational KPIs can be accessed under either Conversational KPI chart or the Intent KPI chart in the mindlytics portal. These KPI charts are auto-created but can be configured to filter the data to suit your unique needs. A few of the intent related KPIs are described below. For more exhaustic list, refer the developer portal documentation.
- Intent Conversion Rate (ICR)
- Measures the effectiveness of your AI agent in resolving user intents. A high ICR indicates that your agent is successfully understanding and fulfilling user goals within a conversation, signaling strong intent recognition and response quality.
- First Intent Friction (FIF)
- Quantifies the responsiveness of your AI agent at the start of a conversation. FIF measures the time taken to resolve the user’s first expressed intent. Lower friction suggests a smoother, faster onboarding experience and early user satisfaction.
- New Intents
- Tracks the emergence of user intents outside the expected scope. This metric highlights the frequency and nature of unexpected or unhandled intents expressed by users, helping teams identify coverage gaps and new demand signals.
- Intent Fulfillment Friction (IFF)
- Measures the level of friction encountered by the AI agent when resolving user intents. Higher friction may indicate prolonged dialogues or delays in achieving intent resolution.
- Intent Fulfillment Sentiment
- Evaluates the sentiment expressed by users during the process of intent fulfillment. This metric provides insights into user satisfaction and emotional tone while fulfilling user need.
- Intent Acceptance Rate (IAR)
- Assesses the frequency and the acceptance rate of the intent recommendations proposed by the AI agent. This metric reflects the relevance and accuracy of the agent’s suggestions.
Besides the foundational KPIs, you could create and configure different analysis charts to track metrics specific to your app and business. In the next sections, you will see some charts — explained using our airline agent example.
2. Intent Volume & Distribution
The mindlytics Intent Distribution Chart gives product managers a real-time view into what users are actually trying to accomplish when they engage with an AI agent. Instead of guessing user demand based on feature releases or anecdotal feedback, this chart aggregates and visualizes detected intents across conversations, helping you understand behavioral patterns at scale.
It answers a fundamental product question:
By surfacing dominant, emerging, and under-served intents, this chart becomes the starting point for roadmap prioritization and resource allocation.
Why tracking intent volume and distribution matters:
Intent distribution chart very quickly lets you understand why people are using your solution or what is their intent when they talk to your agent. From the Product Manager stand point, this chart help- Validates whether the agent matches real user demand. Is your agent optimized for the right intent?
- Surfaces unexpected intents you didn’t design for
- Detect shifts in intent mix after UI or prompt updates
- Validate adoption of newly launched capabilities
- Helps prioritize roadmap investments
3. Intent Conversion Rate
The Intent Conversion Rate provides a clear, outcome-focused view of how effectively your AI agent fulfills user needs.
For every detected intent, it measures the percentage of conversations that successfully reach completion — whether that means resolving an issue, completing a booking, or executing a transaction.
Question it answers:
In conversational interfaces, completion is not guaranteed simply because a dialogue occurred. Mindlytics automatically track and measures conversion of all intents appeared in a conversation. Using the Conversation KPI Chart in the portal, Product Managers can isolate agent performance at the intent level, helping distinguish between high-demand intents and high-performing intents.
Why measuring Intent Conversion matters:
- Separates popular intents from effective ones
- Reveals revenue leakage (e.g., failed upgrades)
- Highlights where conversation design or backend integration breaks down
- Measure business impact like : A 10% increase in Intent Conversion Rate correlates with X% reduction in support costs or Y% increase in upsell revenue.
4. First-Intent Friction
The First Intent Friction chart measures how much effort users experience while attempting to express and execute their primary intent at the beginning of a conversation. It captures signals such as clarification loops, fallback responses, repeated rephrasing, and extended turn counts before the intent is properly recognized or progressed as the user is warming up to the agent.
Question it answers:
This measures:
- Clarification loops
- “I didn’t understand that” responses
- Repeated rephrasing by the user
Why it matters:
- High friction = higher abandonment
- Direct signal of prompt quality, NLU gaps, or UX issues
- Helps PMs optimize how intents are captured, not just whether
- Understand business impact like, Reducing First Intent Friction by 15% lowers fallouts and can boost self-service completion rates.
5. Drop-Off & Escalation Rate
Using the Funnel Charts in the portal, you could measure conversion or drop-off within a conversation and to get a structural view of how users move through intent execution and where they abandon or escalate.
It maps conversational steps and identifies the exact moments where engagement breaks down or can be improved. This is especially critical for high-value or high-complexity intents, such as rebooking flights or completing financial transactions.
For product managers, this visualization shifts the discussion from “users are failing” to “users are failing at this specific step” — enabling precise optimization and experimentation.
Question it answers:
Why it matters:
- Identifies exact conversation moments causing failure
- Quantifies operational cost (agent handoffs)
- Guides which intents should be redesigned vs. automated further
6. Sentiment & Engagement Trends
The Sentiment Analysis chart adds an emotional dimension to agent analytics in aggregate or by a specific intent.
While conversion metrics tell you whether a task was completed, sentiment analytics reveal how users felt during the process. This distinction is crucial: successful intent completion does not always equate to a positive experience.
Question it answers:
By layering sentiment over intent performance, product teams can balance efficiency, trust, and long-term user satisfaction. Mindlytics tracks sentiment shifts across the conversation, not just at the end.
Using the Mindlytics Portal as a PM
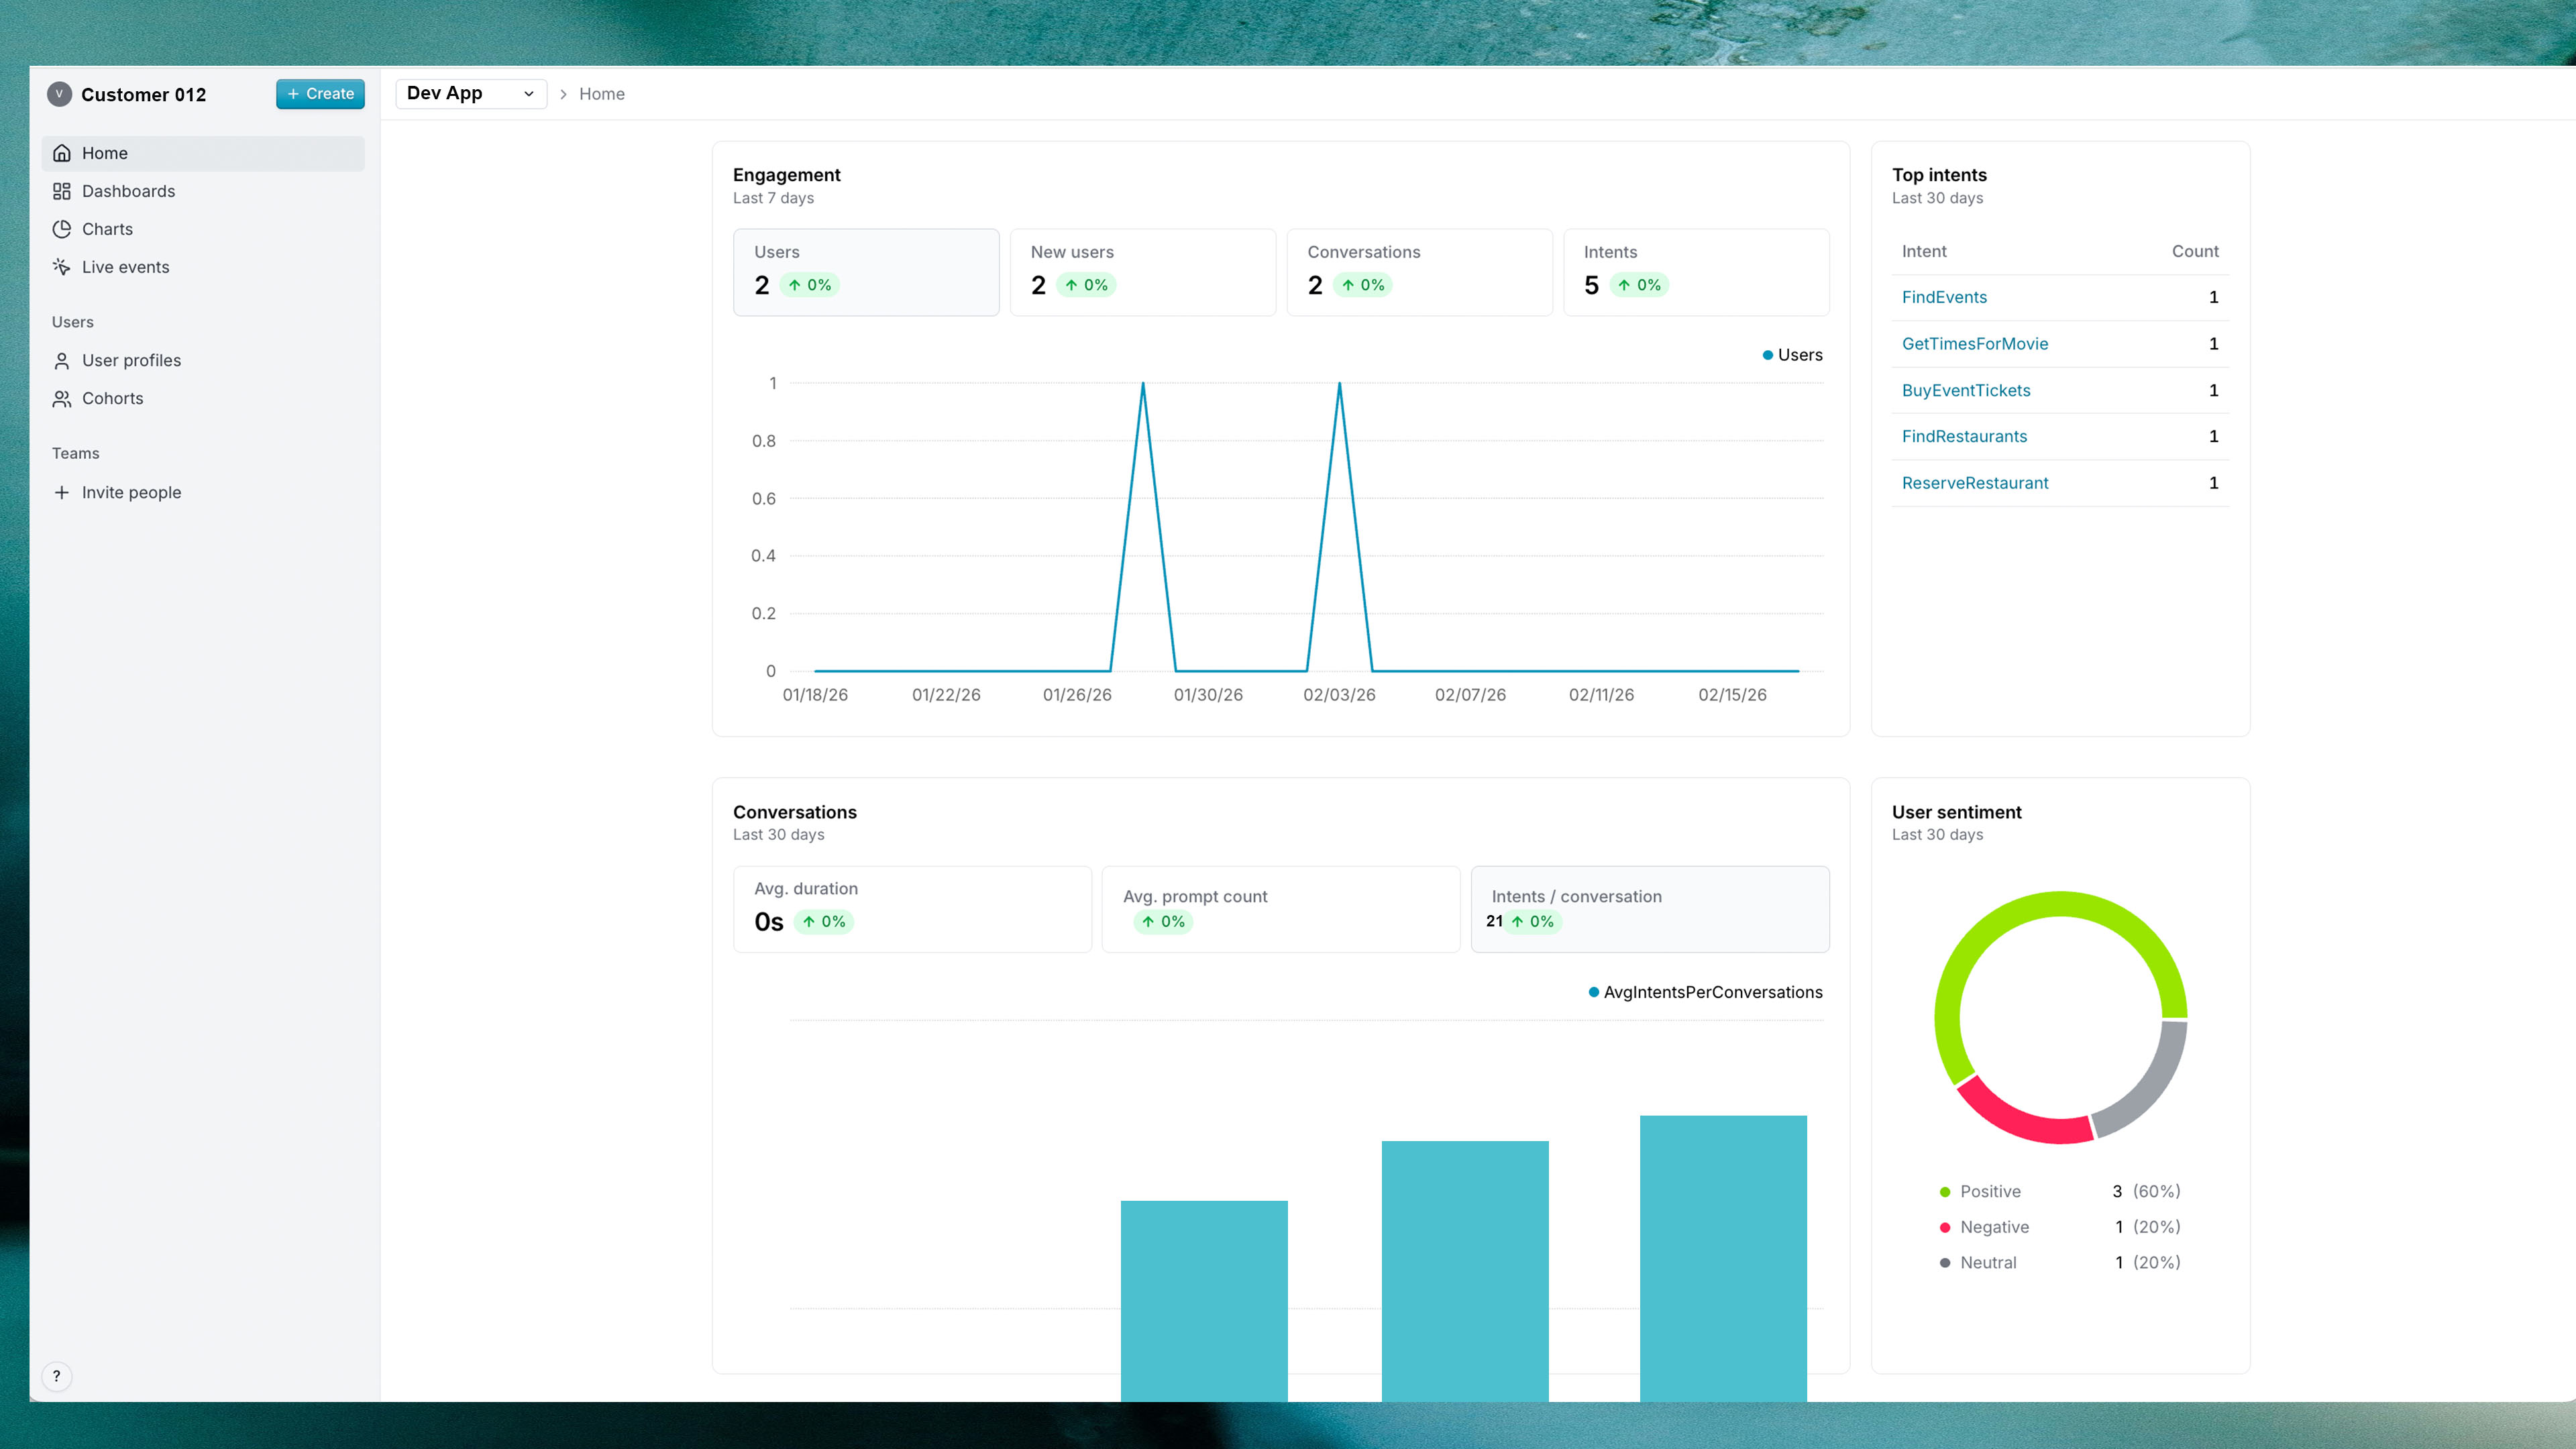
The Mindlytics visualization portal is designed to analyze how your users are engaging with your AI and how effectively AI responds in the context of conversion and user satisfaction.
As a PM, by using the mindlytics visualization portal, you can
- Create metrics and analysis (charts) matching your specific usecase
- Filter and group your analysis by intent, user cohort, channel, or version
- Compare conversion rates before and after prompt changes
- Identify which intents deserve deeper automation
- Tie conversational outcomes directly to business KPIs
Conversational AI is not magic. It’s software — and software needs measurement.
Mindlytics helps product managers understand why users talk to agents, measure if those user needs are met and optimize how conversions drive